
Table of Contents:
Overview
Getting Started
Clinical Dashboard
Operations Dashboard
Finance Dashboard
Things to Know
Overview
What Is Residex Insights?
Residex Insights is a set of dashboards built into Residex that replaces manual, export-heavy reporting. It brings clinical, operational, and financial data that already lives in Residex into dashboards you can act on immediately, without leaving the platform.
What's Included?
Residex Insights includes eight dashboards across three areas: six Clinical dashboards (Assessments, Falls, Hospice & Home Care, Incidents, Infections, and Medications), one combined Operations dashboard, and one combined Finance dashboard.
How Is It Different From Standard Reporting?
Standard Residex reports are static and reviewed after the fact. Insights dashboards are graphical and interactive — you can filter by campus, time period, and more without exporting anything. Data refreshes overnight, so today's activity shows up the next day.
When Is It Available?
Residex Insights launches September 30, 2026, and is enabled by default for all existing and new Residex customers — no setup required.
Getting Started
Who Can Use Residex Insights
Residex Insights comes at no extra cost if your care provider is licensed for the EHR and eMAR. It isn't available if your community is only licensed for the Workforce module.
Each staff member needs the right role to open each section. Your Residex administrator sets this up from a staff member's Staff Profile, under Security.
|
Section |
Roles That Can Open It |
|
Clinical |
Resident Data Access – Clinical (Role 19), Administration – Supervisor (Role 13), or Administration – Manager (Role 11) |
|
Operations |
Administration – Supervisor (Role 13) or Administration – Manager (Role 11) |
|
Finance |
Residex Billing Feature Required AND Billing/Financial – Billing Supervisor (Role 23), Billing Manager (Role 28), or Accounts Receivable (Role 22) |
A staff member without one of these roles won't see that section. If Insights doesn't appear in your menu at all, contact Residex Support.
Where to Find It
Select Insights from the top menu, then choose Clinical, Operations, or Finance from the menu that opens.

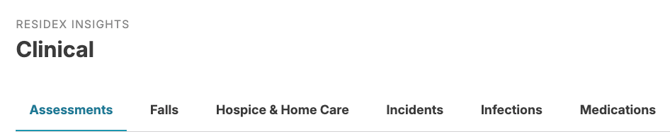
Insights opens to three sections. Clinical holds a set of dashboards, shown as tabs across the top. Operations and Finance are each a single dashboard.
|
Section |
Dashboards |
|
Clinical |
Assessments · Falls · Hospice & Home Care · Incidents · Infections · Medications |
|
Operations |
A single census, capacity, and movement dashboard |
|
Finance |
A single billing and payments dashboard |
How Often the Data Updates
Insights updates overnight. Anything you chart today shows up in Insights tomorrow — not right away.
If you need to see today's activity, use Today, eCharting, the eMAR, or a report instead.
What's On Every Dashboard
Every dashboard has the same basic pieces:
- The section name and the refresh reminder
- Tabs across the top, one for each dashboard in that section
- Filters that control everything shown below them
- Summary cards with the big, headline numbers
- Charts and tables grouped under plain headings
How to Read Any Dashboard
Every Residex Insights dashboard uses the same controls and the same reading rules. Learn them once, and every dashboard works the same way.
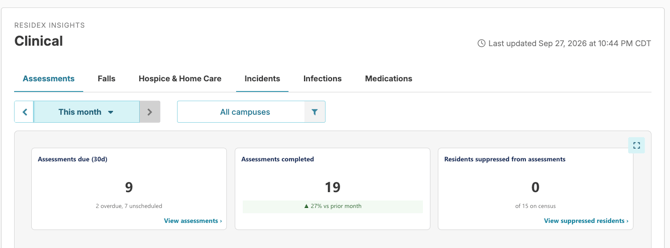
The Assessments dashboard showing the period and campus filters and summary cards.
Filters
Filters sit under the tabs and apply to everything below them.
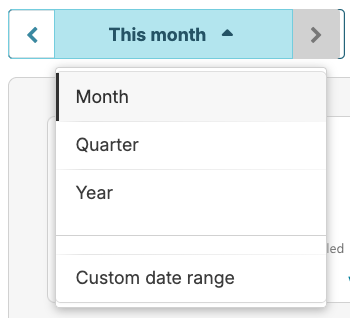
- Period: choose a month, a quarter, a year, or a specific date range. Arrows step you backward and forward through whichever view you've picked.
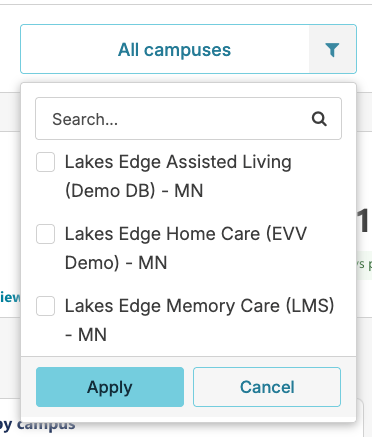
- Campus: narrow the dashboard to one or more specific campuses.
Some charts ignore the period filter on purpose: a chart that always shows a fixed stretch of months keeps that window no matter what you pick. The subtitle under the chart tells you the window it's using.
Summary Cards
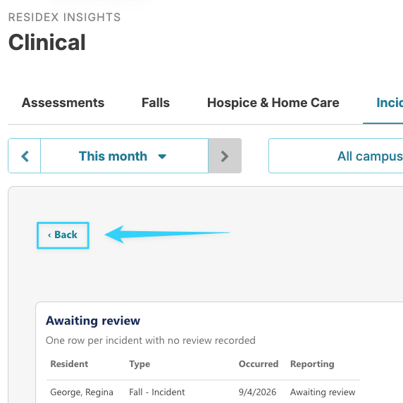
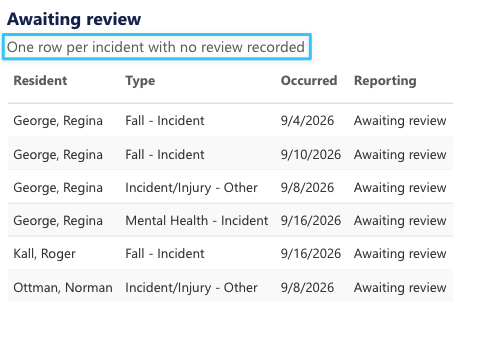
The row of cards at the top of most dashboards shows the big numbers. Each card shows a figure, plus a comparison to the prior period, a note on what it includes, or both. Some cards link straight to the records behind the number. Select a link like "View awaiting review" to open a detail table, then select "‹ Back" to return to the dashboard.

Panel Subtitles
The small gray line under a chart's title is the most important text on the page it tells you exactly what the chart counts, over what time, and what it leaves out. Always read this line before you read the chart.
Tables
Tables tell you their sort order in the subtitle, for example, "Most overdue first." Scroll inside a table to see more rows.
Clinical Dashboard
Six dashboards covering resident care and clinical compliance. Requires: Resident Data Access – Clinical (Role 19), Administration – Supervisor (Role 13), or Administration – Manager (Role 11).
|
Dashboard |
Open It When You Want To Know |
|
Assessments |
Which residents are due or overdue for an assessment, which campus is furthest behind, and which assessment types your staff are completing. |
|
Falls |
How many falls occurred, when they happen, how serious the outcomes were, and which residents lack a fall risk assessment. |
|
Hospice & Home Care |
Which residents are receiving hospice or home care, which organizations provide it, and how that spreads across campuses. |
|
Incidents |
How many incidents were recorded, which are still awaiting review, and what types are occurring. |
|
Infections |
Charted infection reports for residents and staff, where infections occur, and how the picture changes over time. |
|
Medications |
Whether medications are passed on time, how often they're declined or skipped, and where errors occur. |
Operations Dashboard
One dashboard covering census, capacity, holds, and the move-in pipeline. Requires: Administration – Supervisor (Role 13) or Administration – Manager (Role 11).
|
Dashboard |
Open It When You Want To Know |
|
Operations |
How many residents you have, how they split across housing types, how full your units are, how long residents spend on hold, and how the move-in pipeline is trending. |
Finance Dashboard
One dashboard covering billing and payments. Requires: Residex billing feature add-on AND Billing/Financial – Billing Supervisor (Role 23), Billing Manager (Role 28), or Accounts Receivable (Role 22).
|
Dashboard |
Open It When You Want To Know |
|
Finance |
What you billed in a period, what came in, and how billing splits between private pay and public pay. |
⚠️ ALERT: This dashboard will not display unless the Residex Billing Feature is enabled for that campus.
A Few Things Worth Knowing
Good to know
Insights updates overnight, so every figure reflects data as of the last refresh — not the current moment. A report you run today includes today's charting; an Insights figure does not.
Good to know
Census counts residents. Occupancy counts units. A shared unit can hold more than one resident, so the two numbers won't match — and that's expected.
Good to know
Billed charges means invoices posted in a period, not money earned. Payments received can include payments for older invoices. Because of this, the two won't reconcile against each other for a single period.
Good to know
A resident marked "Suppress Assessments" via Resident profile > update profile > "suppresses assessments box check" is left out of every missing-assessment figure across Insights, so a resident you've deliberately excluded doesn't read as a compliance gap.
Good to know
Limited resident access users do not have access to Insights. This ensures PHI stays visible only to staff who are authorized to see it.