Quality Assurance Dashboard Report
This report provides a 12-month retrospective look at some key performance indicators.
Note that there is an "All Campus" version of this report for organizations with multiple campuses.
Falls
This data pulls data from incidents entered as falls. Specifically:
- Falls - Total number of falls for a given month
- > 2 falls - Residents with more than 2 falls that month
- Falls per 1K Days - Presents data as a ratio of the number of falls per 1000 days of active resident stays. This allows users to adjust for census fluctuations or compare campuses of different sizes.
Med Errors
This data pulls from incidents entered as medication errors. Specifically:
- Med Errors - Total number of medication errors reported that month
- Med Errors per 1K Passes - takes the number of med errors for the month over the total number of med passes (med assist services) that month. This ratio corrects for census fluctuations or variations in campus sizes.
Other Incidents
- Shows the total number of all other types of Resident Incidents (not falls or med errors) recorded that month
Hospitalizations
- Hospitalizations - Displays the number of residents who were placed on Hold that month for whom the reason "Hospital" was selected.
- Re-Hospitalizations - Identifies any residents who were re-hospitalized within 30 days of a previous hospitalization (regardless of reason)
- Rehospitalization Rate - Rehospitalization rate is calculated by dividing the number of rehospitalized residents by the total number of admissions to the hospital during that period. Note that it does not factor in reason for admissions.
Antibiotics / Infections
- Antibiotic Orders - Identifies the total number of meds flagged as antibiotics (from the global medication list) that are scheduled for a resident
- Incident Type Infections - If you have a Resident Incident type in which you track infections, this will show the number of new infection incidents reported during the month
Psychotropic Med Use
-
Psychotropics Scheduled - Shows the total number of regularly scheduled medications flagged as psychotropic for all active residents during the month.
-
Psychotropic PRN - Shows PRN meds flagged as psychotropic that are prescribed. To review if a med is flagged as a psychotropic, go to the global medication list.
-
Psychotropic PRN Usage rate - PRN meds flagged as psychotropics administered in the select time period
-
Staff Turnover - Shows the total number of staff terminations /inactivations in a month over the total number of staff as of the date the data is generated (the first of the month). Excludes non-facility staff from the count.
Services
- Services Not Charted (Missed) - Services not charted as completed or declined for the given period
- Missed Services Rate - Ratio of services not charted as completed or declined over the total number of scheduled services for the month
Medications
- Meds Not Charted - Medications not charted as administered or declined for the month
- Missed Medications Rate - Ratio showing medications not charted as administered or declined over the total number of medications passed for the month
- Meds Scheduled - Total number of medications scheduled for administration for the month
- Meds passed Count - Total number of medications charted as completed or declined
- Med Passes Count - Total number of med passes (med services) provided for the month
Assessments
- Assessments Late - Total number of assessments recorded as late in the month
- Assessments Count - Total number of assessments due in the month
Campus Trends
Campus Trends Access
Access to this feature is granted to staff from their Staff Profile > Security > Other Roles. You can opt for either a 'Campus Director' (campus-specific) view, or a broader, 'Regional Director' view for multi-campus organizations.
Campus Trends View
Navigate to the Reports > Campus Trends option. Categories of data are listed, from assessments and billing to resources and service recap. Click on the links to present the graphs and charts; clicking on a particular graph will enlarge it for easier viewing. Hovering your cursor over an area can provide additional detail.
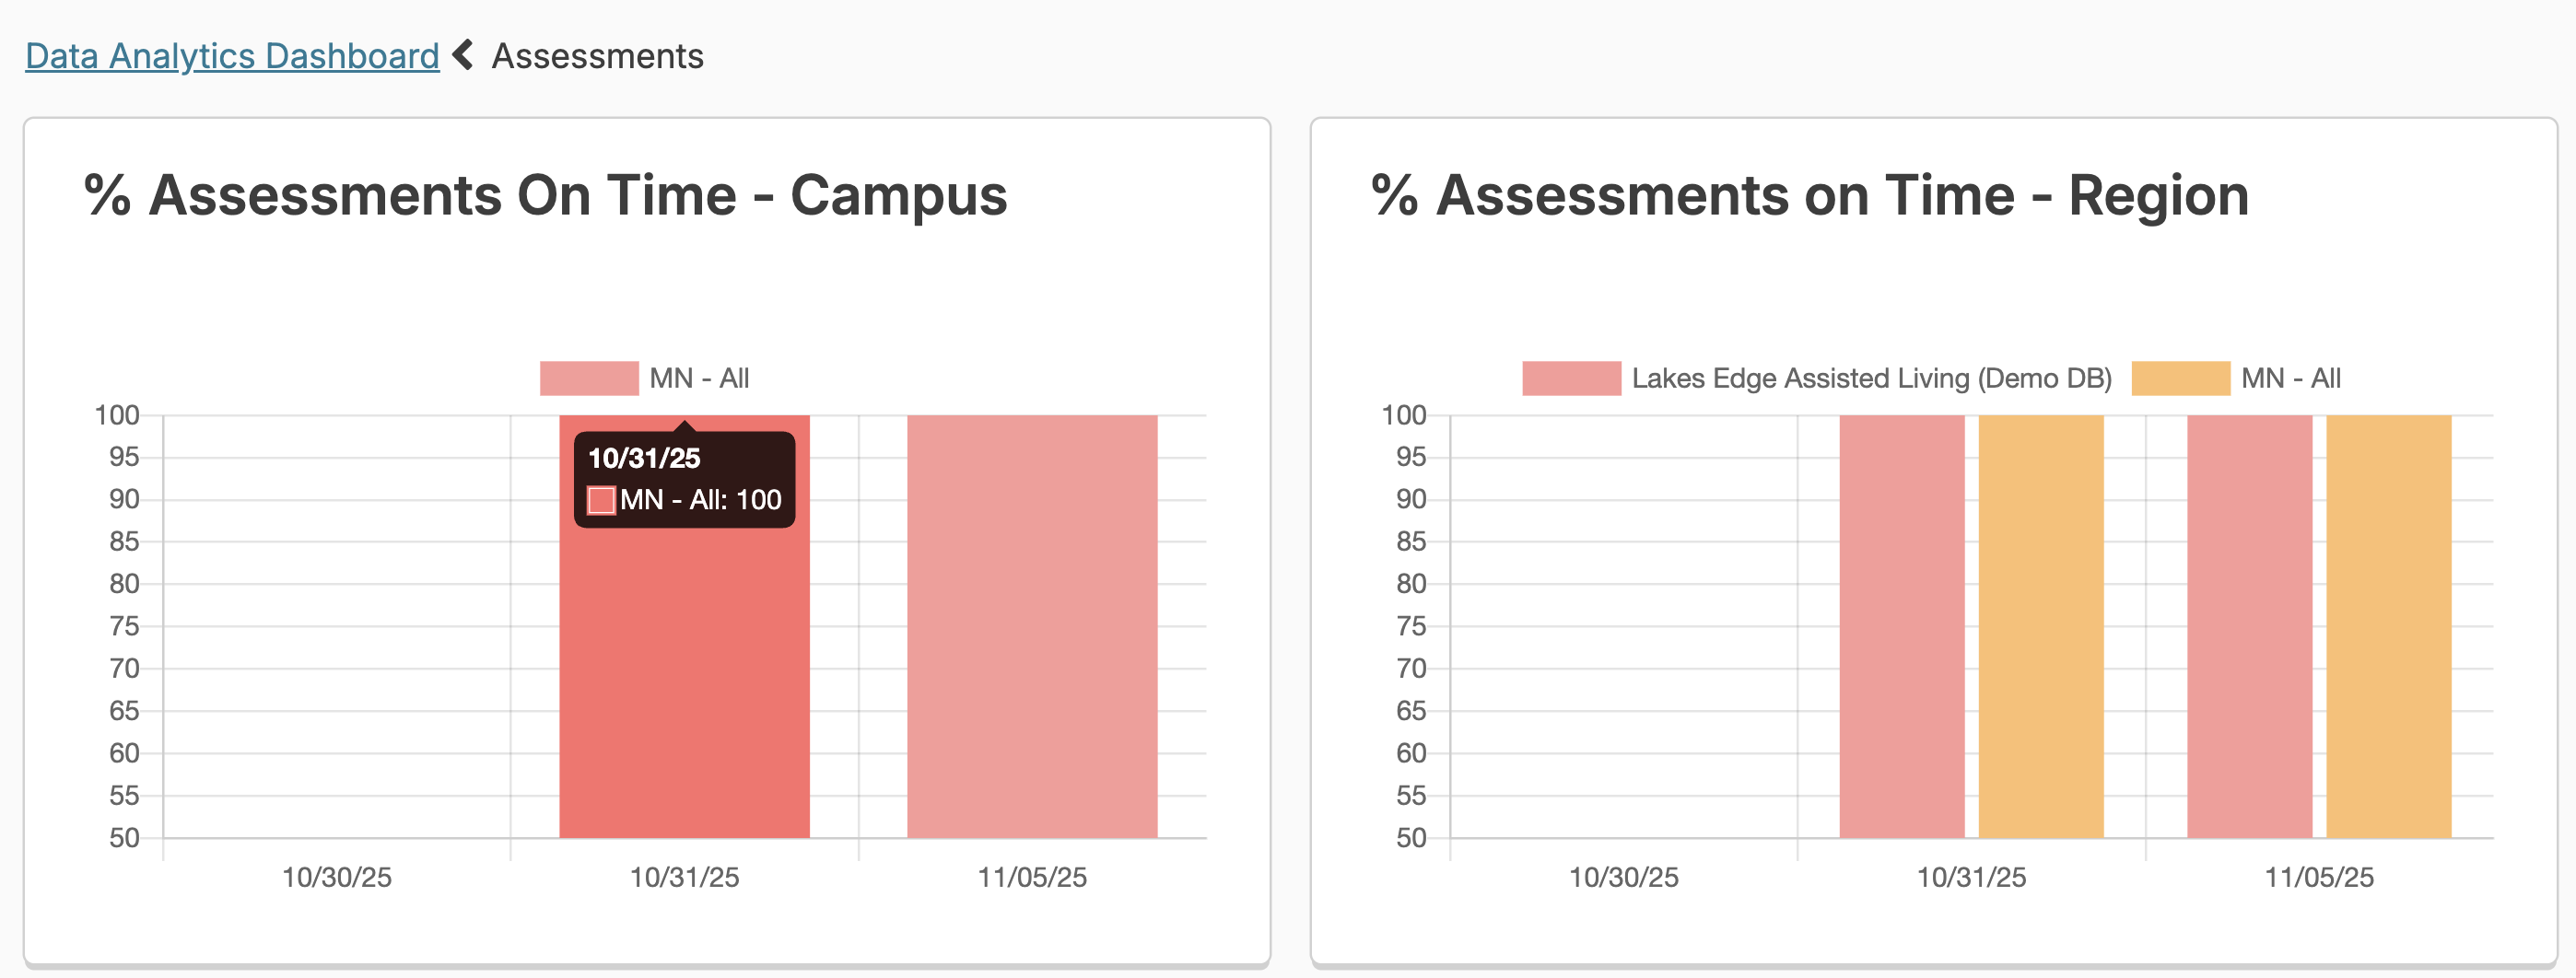
This graphing analysis is helpful in quickly understanding trends and gaining insight into campus statuses.
The regional graphing role offers the ability to choose local, regional, or global views and compare campuses. Regional encompasses all campuses within a state and global would include all campuses in the database.
Quality Assurance Status Report
In addition to the dashboard tools, you also have the Residex QA Status tool to view the status of your key quality assurance indicators on one screen.
Select Reports > QA Status to view the quality assurance status screen
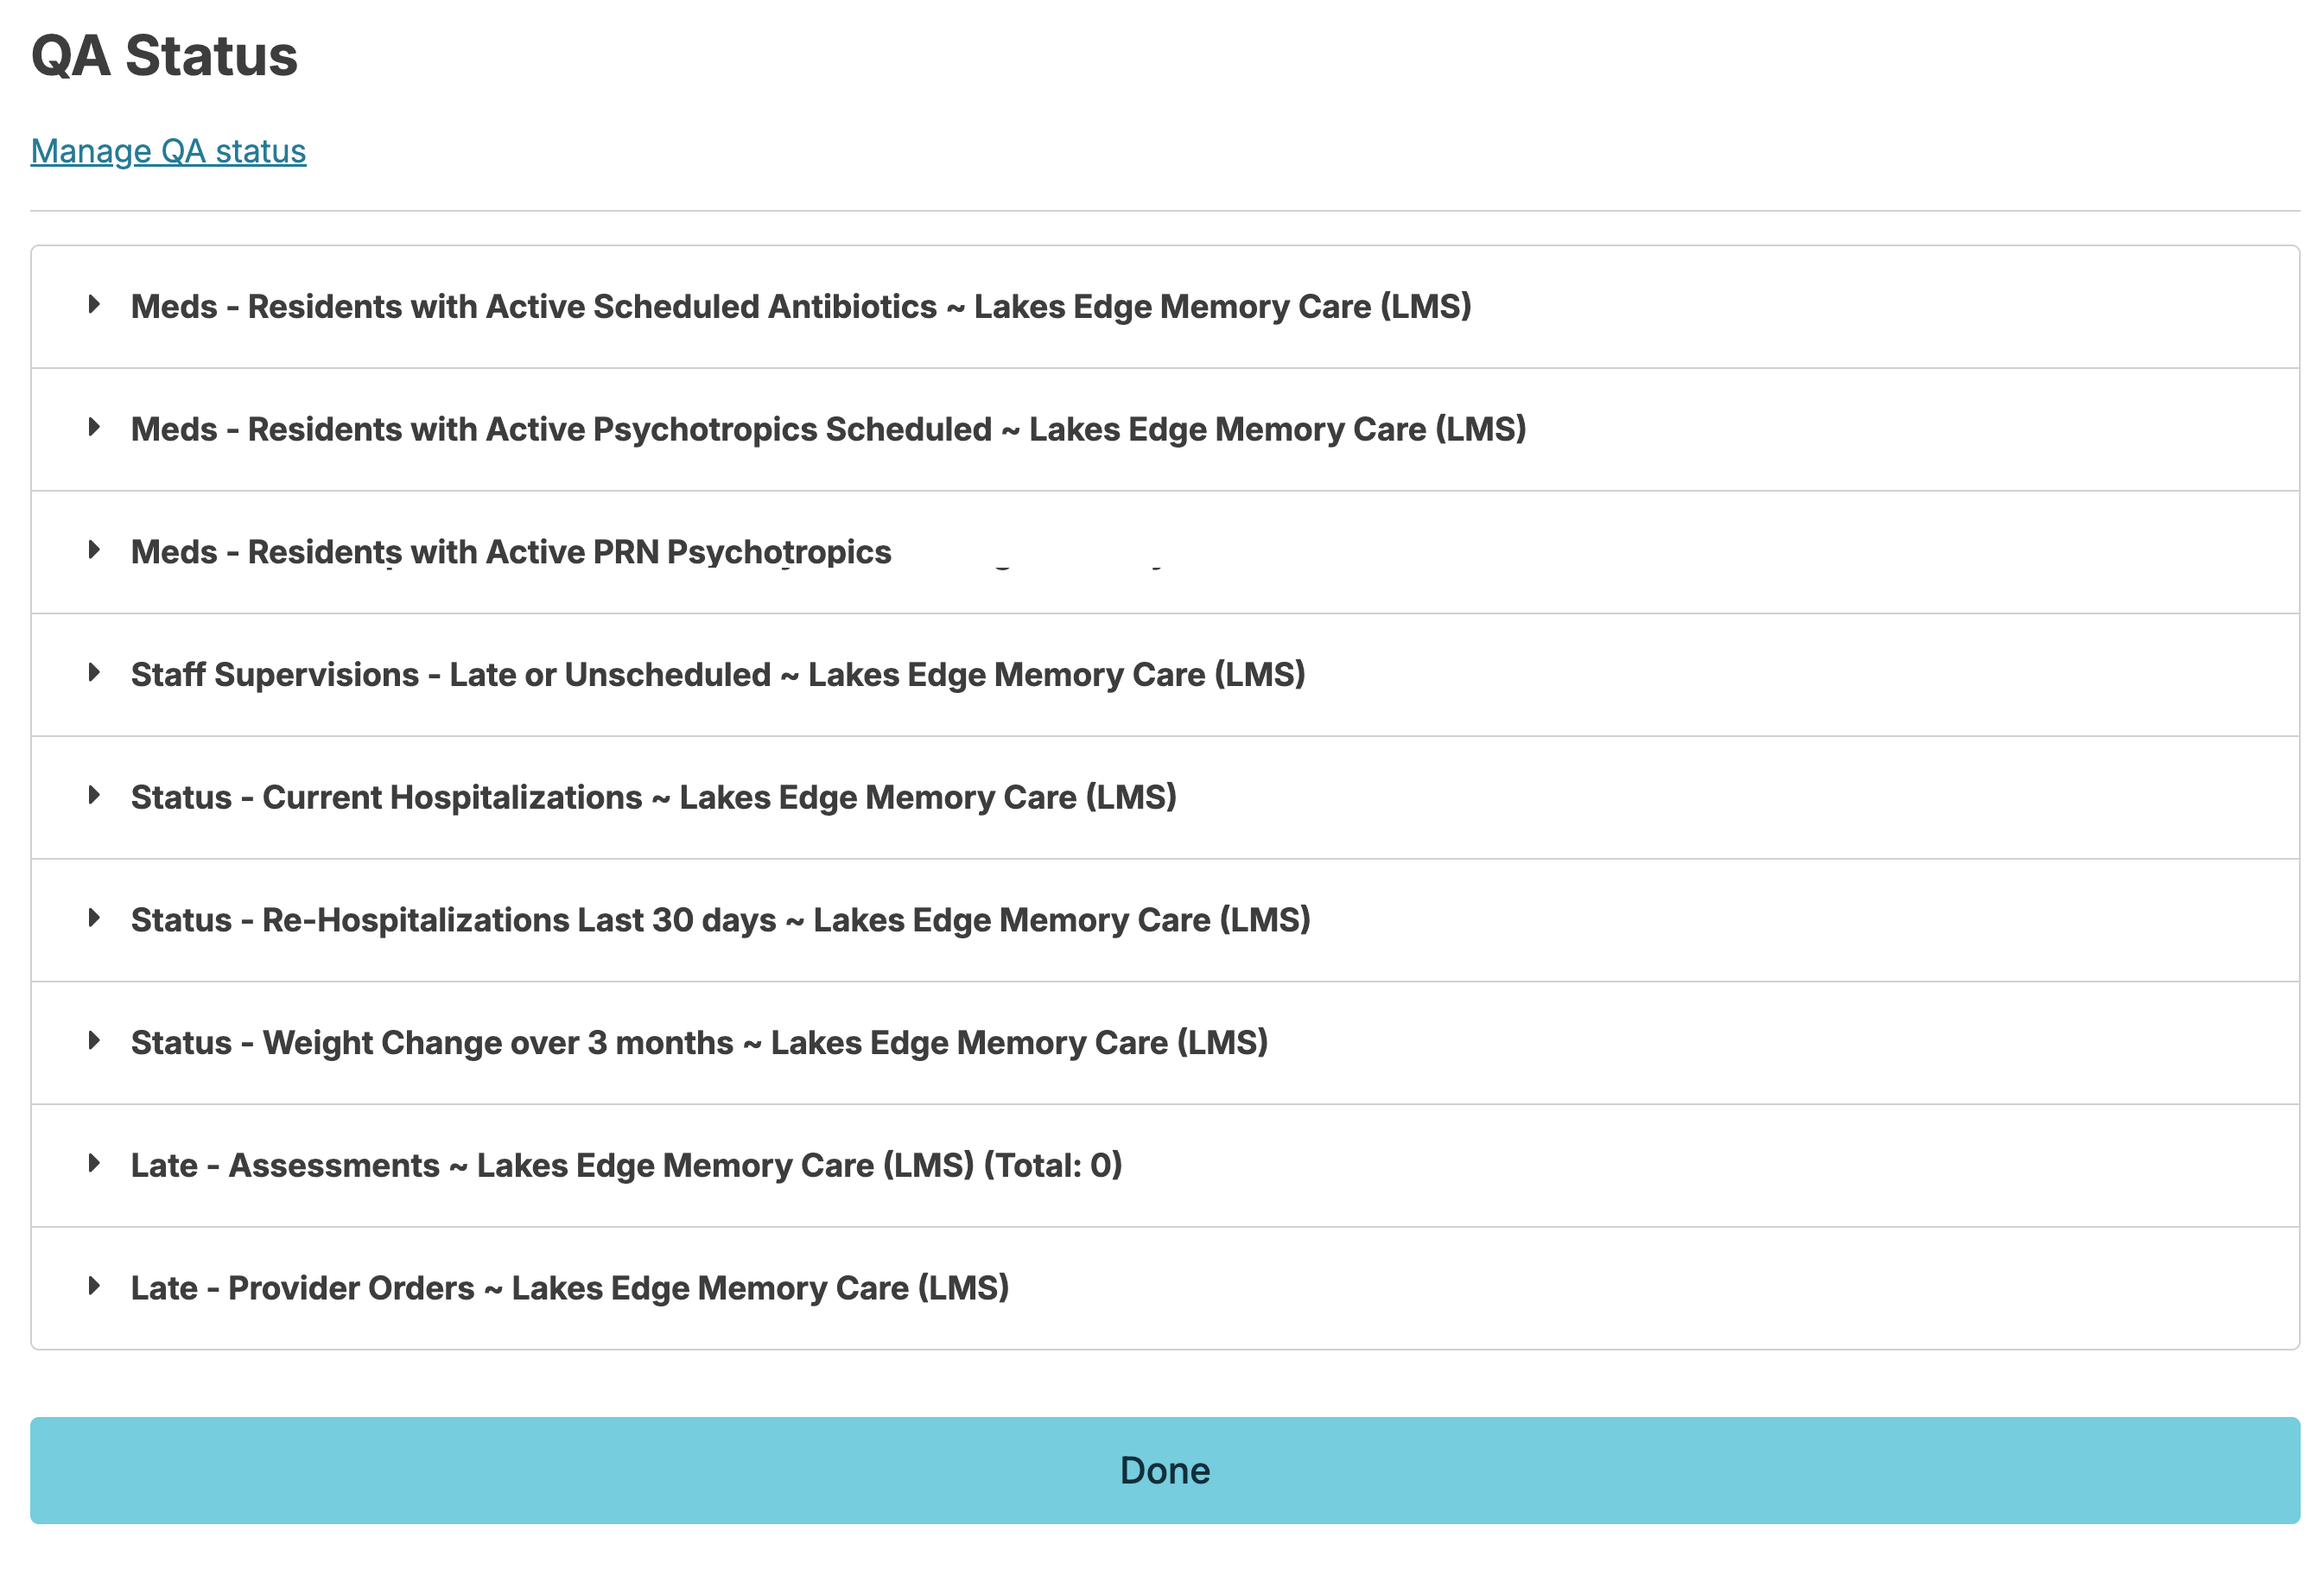
This screen will show a list of your organizations specific key quality indicators as determined by your individual permissions. Click on any item to view the specifics.